
Data Visualization: PxPlus and Charting
In today’s business world, there are ever-growing expectations for graphic presentation of data. Displaying data visually makes it easier for users to make comparisons and see trends. One of the most effective ways to present data is through graphs and charts.
Charting alternatives
To address this need in previous versions of PxPlus, we introduced support for several brands and types of charts to cover your every need. These include
- HTML5-based rGraph Charts
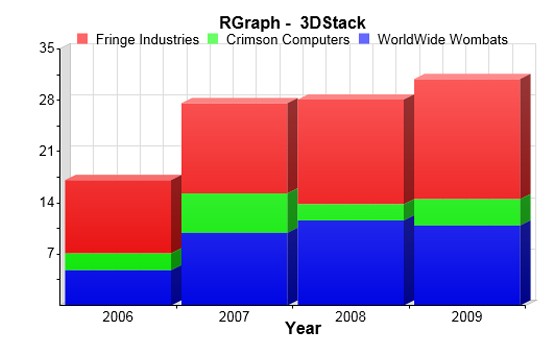
- Internet-based Google Interactive Charts
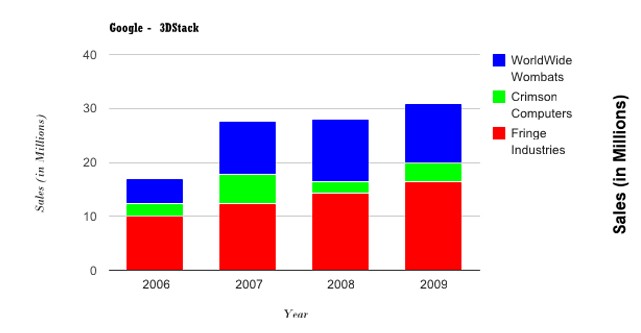
- Flash-based Fusion Free and Fusion Charts
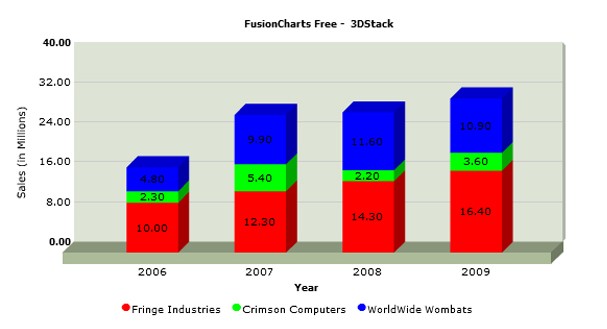
These charting alternatives to the internal chart control are defined using the Nomads chart definition interface and require few or no changes to existing code.
The chart classes are easily interchangeable, and offer a richer UI experience with interactive, animated charts and additional formats. They are supported in both Nomads and iNomads environments.
AutoCharts
 Our next step was to introduce AutoCharts, a simple way to add charting to any application that presents tabular information.
Just right-click on any grid, multi-column listbox, or Query+ display at run time, and you can design pie charts, line charts, and bar charts on the fly.
You can display simple values, counts, sums, minimums, maximums, and averages using the PxPlus Chart Wizard, without having to write any code! Then, simply right-click again to display the chart whenever you want.
It’s so easy, even your end users can do it!
Generating chart images
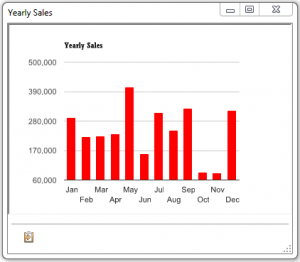
Our most recent addition to the family of charting features is the ability to create images of charts for display on Windows tiles, on dashboards, on a website, or as part of your application.
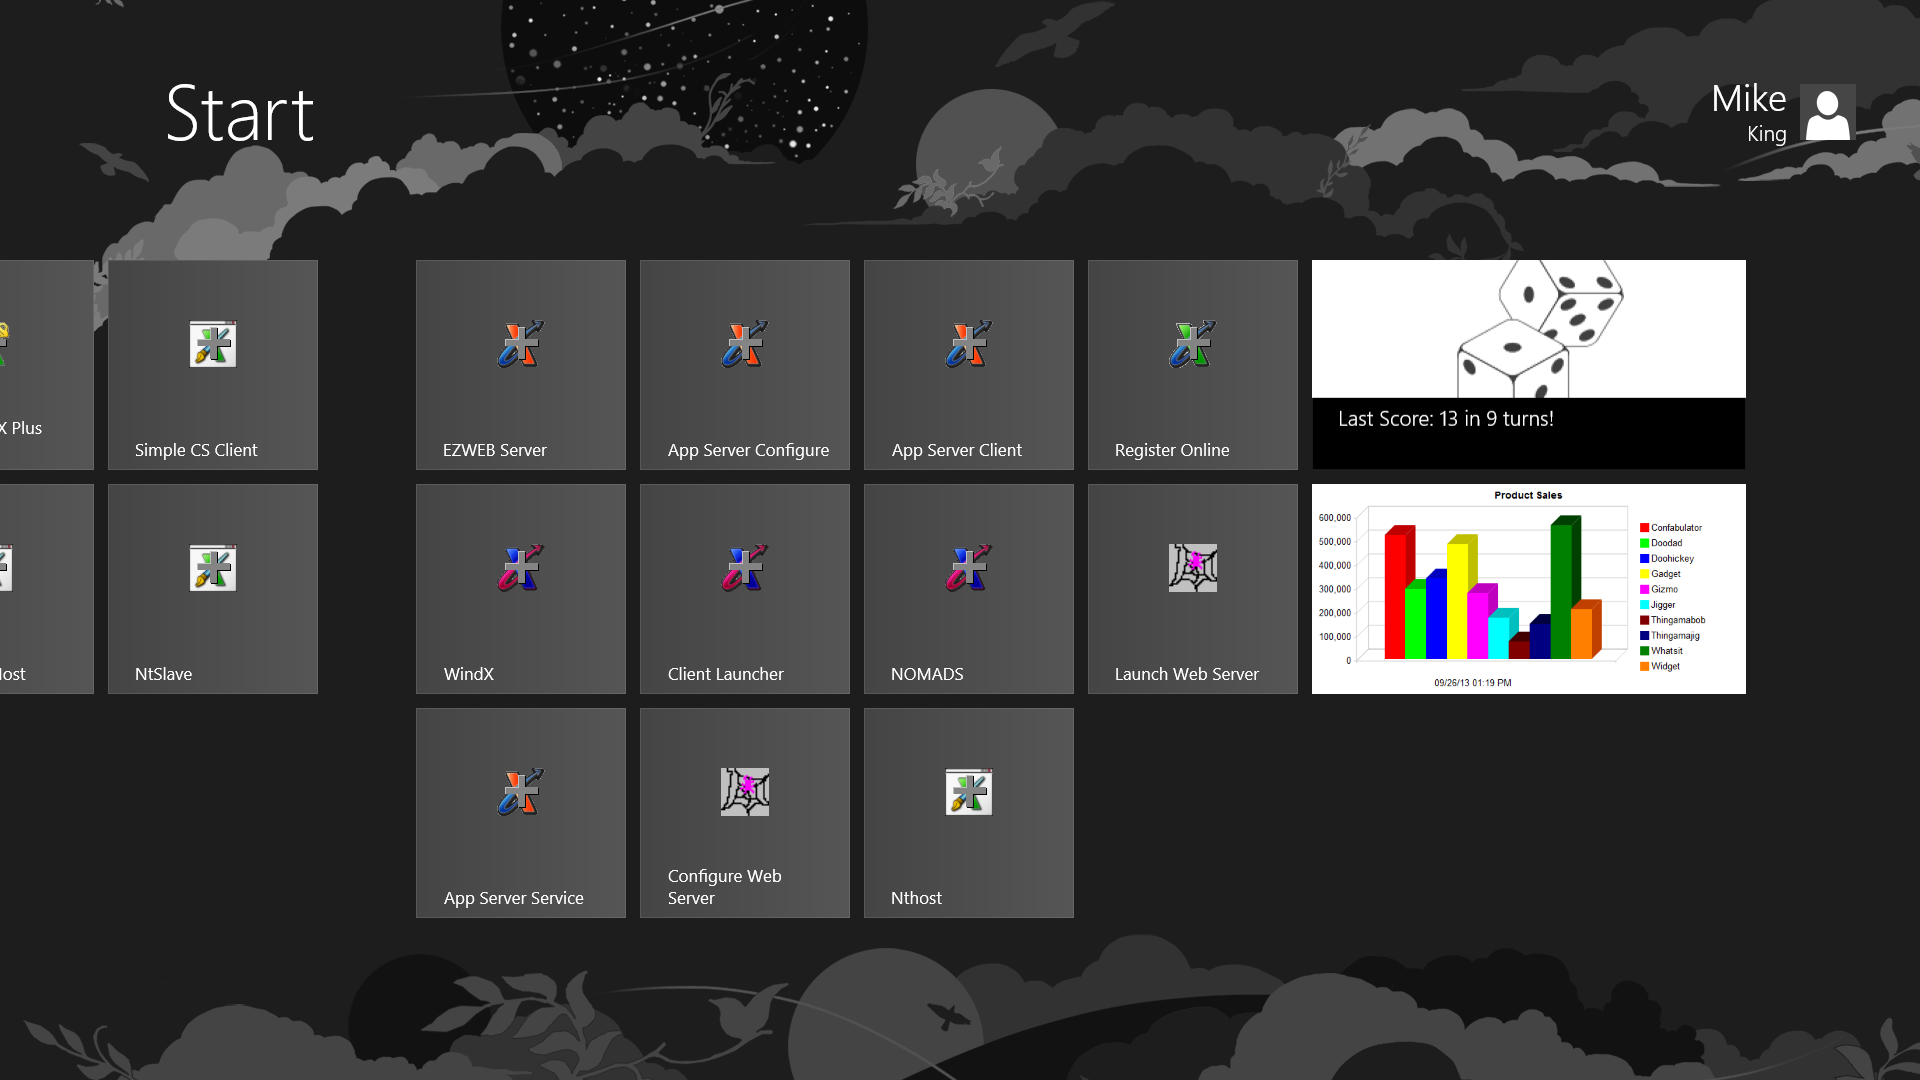
Click to enlarge
The chart images, featuring Google or rGraph charts, can be based on AutoChart definitions associated with PxPlus Queries, or you can write your own code using our special utilities for a more complex analysis and display. In addition to images, you can generate HTML pages that provide a more dynamic display for inclusion on a website.
But we didn’t stop there. We also have a scheduling utility to generate updated charts on a fixed schedule ranging from every 5 minutes to once a day — or you can generate charts on an on-demand basis. You can even generate images specifically for inclusion on a PxPlus myTiles live tile on a Windows 8 Start screen.
With the variety of charting and graphing alternatives in PxPlus, you can easily adapt to all your users’ needs — and even offer them valuable data in a way they might not even have thought of!
[cta]For more information about Charting Alternatives in PxPlus, NOMADS Autochart, Chart Images Generation, and Chart Image Utilities, click here. Still have questions? Contact us any time by email at theplus@pvxplus.com or by phone at 1-888-975-PLUS.[/cta]